

Metrics Details
This dashboard provides a comprehensive view of a metric, allowing you to monitor its performance over time and make informed decisions based on the data trends.
To view the metric details:
-
Navigate to Platform Applications > Genix Metrics Hub.
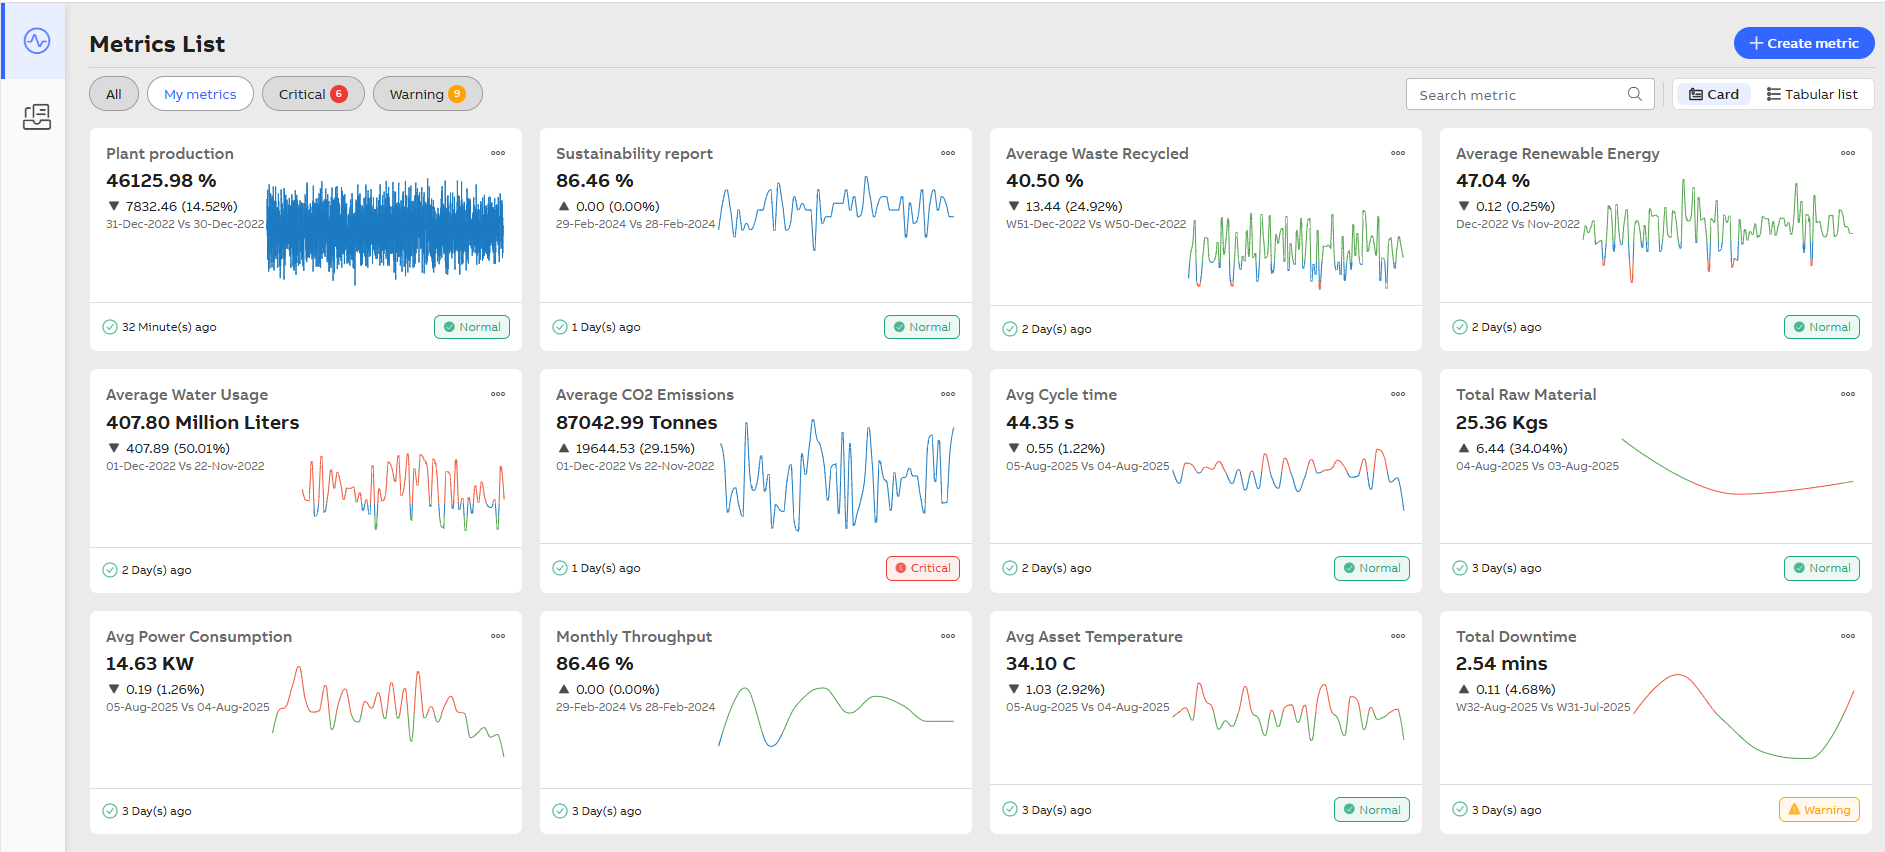
Metric List
-
Click the metric card to navigate to the Metric Details screen.
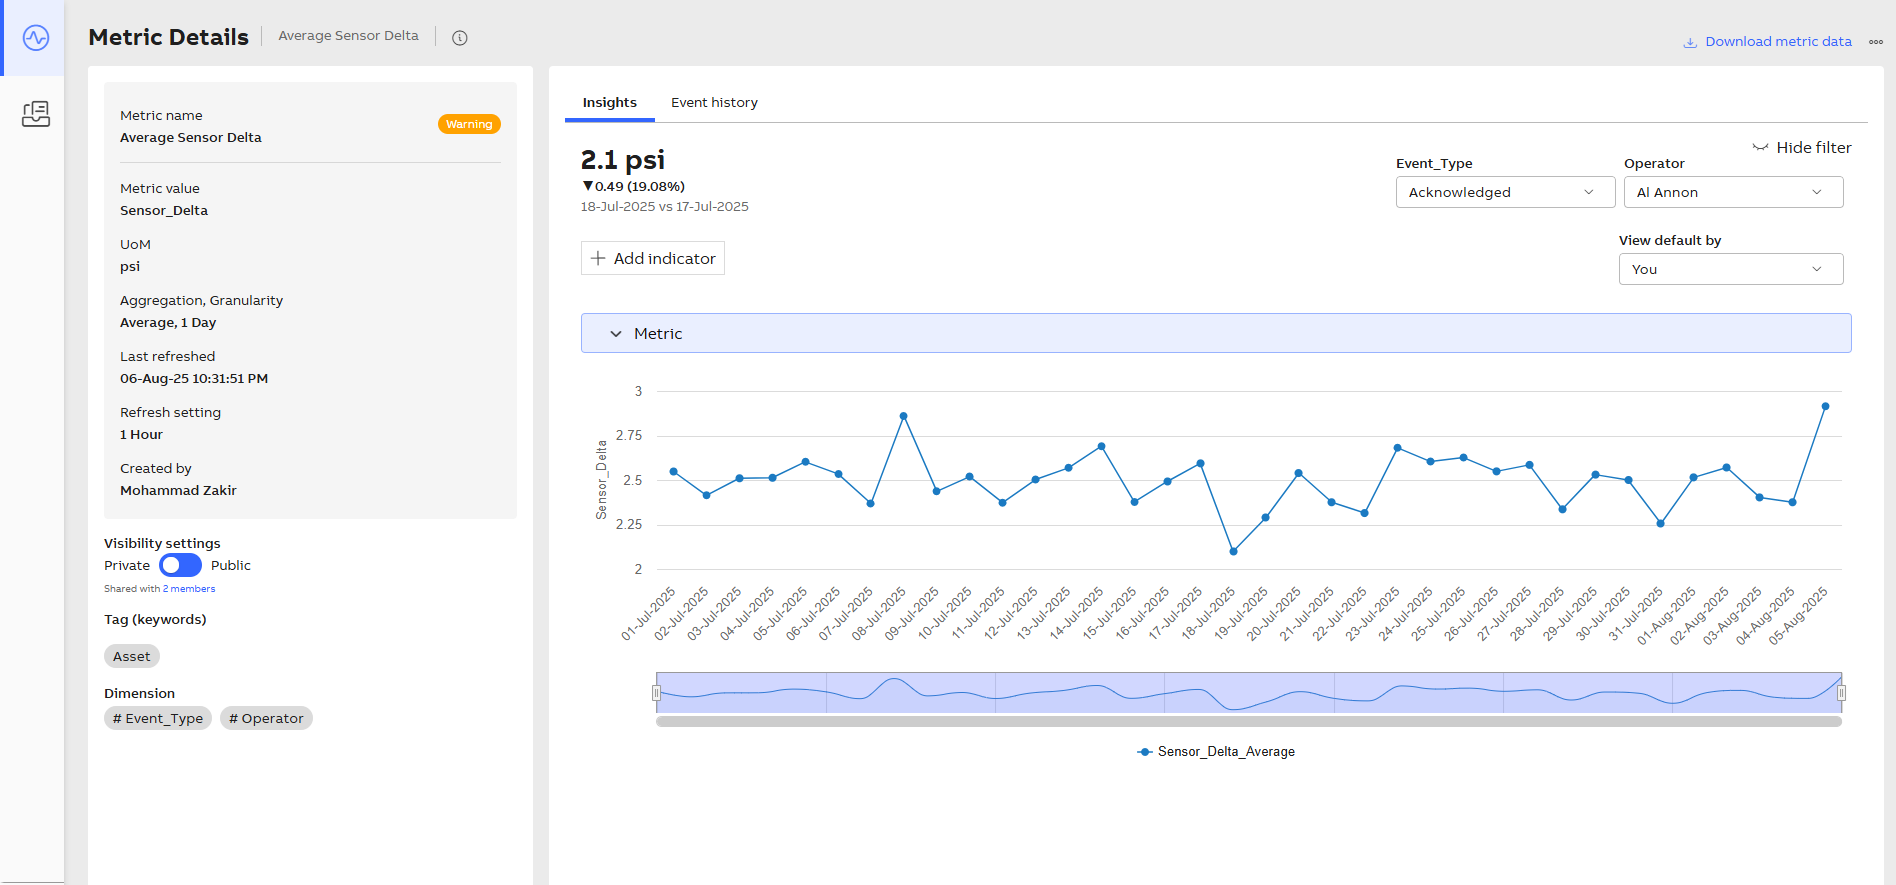
Metric Details
The following information gets displayed on the screen:
|
Fields |
Descriptions |
|---|---|
|
Metric name |
Displays the metric name and status. |
|
Metric value |
Value of the metric. For more information , see Name & Description. |
|
UoM |
Unit of measurement used to create the metric. It can be configured under Display Configuration. |
|
Aggregation |
The process of taking multiple input values and then using them to produce a single output value via the rules defined by the aggregation type. Example of Aggregation Type: Sum, Min, Max, Avg, Count, First and Last.
|
|
Granularity |
The time period used to aggregate values together to allow display on a chart. It should be smaller than the selected time range . For more information , see Metric Definition. |
|
Last Refreshed |
Most recent time when the data was updated or synchronized in a system or report. |
|
Refresh setting |
Determines how frequently metric data is updated on the screen, ensuring real-time or scheduled visibility of performance changes. |
|
Created By |
Name of the individual who created the metric. |
|
Tags (Keywords) |
The added tags while creating the metric. For more information, see Name & Description. |
|
Visibility Settings |
To grant access to the metric for users or groups. Private: To provide access to specific users. Public: To provide access to all users. Click Shared with <X> members to grant access to the metric for users or groups. For more information, see Share Metric. |
|
Dimension |
Dimensions facilitate slicing and dicing of data. For more information , see Metric Definition. |
|
Download metric data |
Download a zip file containing calculated metric data. |
|
View More/Ellipse icon |
The following actions are available on the more actions menu:
|
|
Insights |
Key observations based on system behavior. For more information, see Insights. |
|
Event history |
Detailed timeline of events captured by the system. For more information, see Event history. |