

Insights
The Insights section provides key observations and data-driven summaries derived from system activity and event patterns.
Insights
-
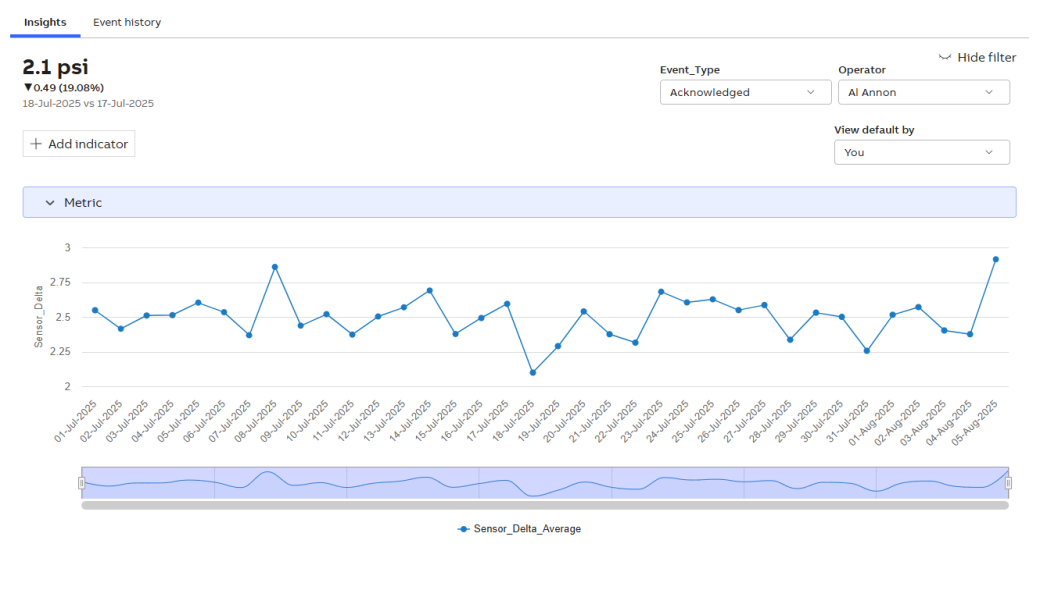
Click Insights to view graphical details of the calculated metric. For more information, see Display Configuration.
-
Show/Hide filter: Enable the following options.
-
Dimension type: Allows you to select dimension types and apply filters based on the configured dimensions of the metric.
-
View default by: Allows you to view the owner of the metric.
-
-
Add indicator
-
The Select Indicators pop-up appears, then enable the checkbox to select the derivation type.
- Moving Sum: A moving sum is a calculation that determines the sum of a set number of previous values in a dataset as it progresses over time. It is commonly used in time series analysis to smooth fluctuations and identify trends.
-
Moving Average: A moving average is the average of a set number of previous values over a rolling window. It helps smooth out short-term fluctuations and highlights longer-term trends.
-
Running Total: A running total (also called a cumulative sum) is a continuously updated sum that adds each new value to the previous total.
-
Click Apply. Once the metric calculation (derived metric calculation) is complete, the metric preview is available.
-
Zoom in on the graph to select a specific date range.
-