

Display Configuration
The Display Configuration step defines the metrics display settings, visualizing the data through graphs, analyzing and interpreting the data, to make informed decisions. The finalized display configuration is reflected on both the metric card and the metric details screens.
The calculation for the metric is based on the selected metric definition. A preview of the metric is provided as follows.
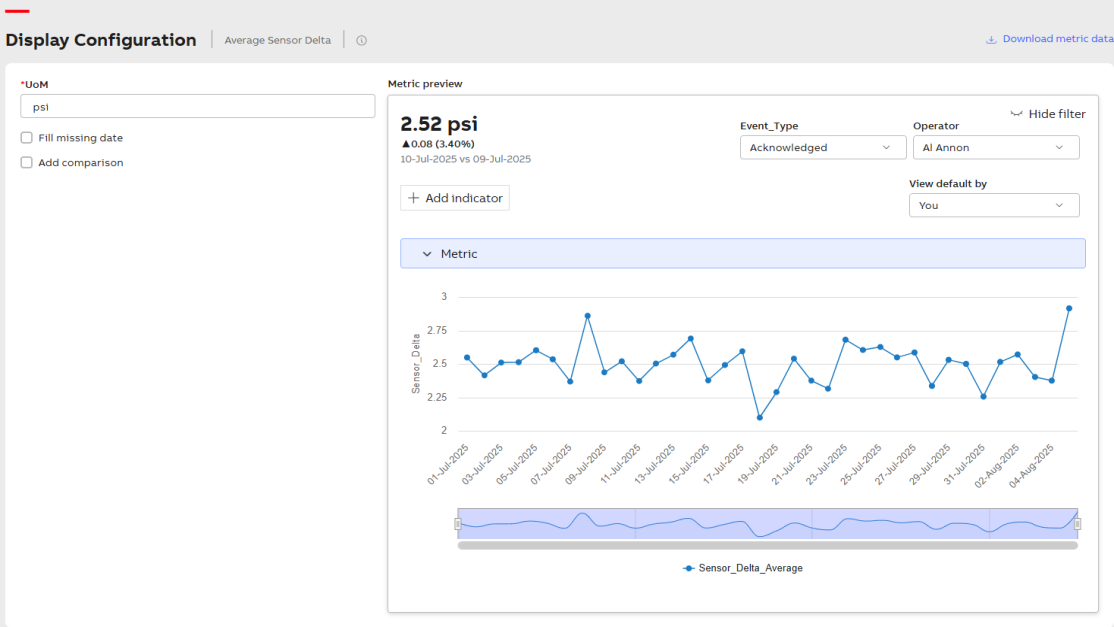
Metric Preview
To enter information into the Display Configuration step:
-
Enter UoM
Click UoM field and enter the unit of measurement.
-
Fill in the missing date
Enable Fill missing date checkbox to fill in metric values for missing timestamps by harmonizing them.
-
Preview of Metric
The Metric preview shows the metric name, latest aggregated metric value, trend, date range filter, and options to slice and dice by dimensions, among other features.
-
Choose Comparison Type
Enable Add comparison and perform the following:
-
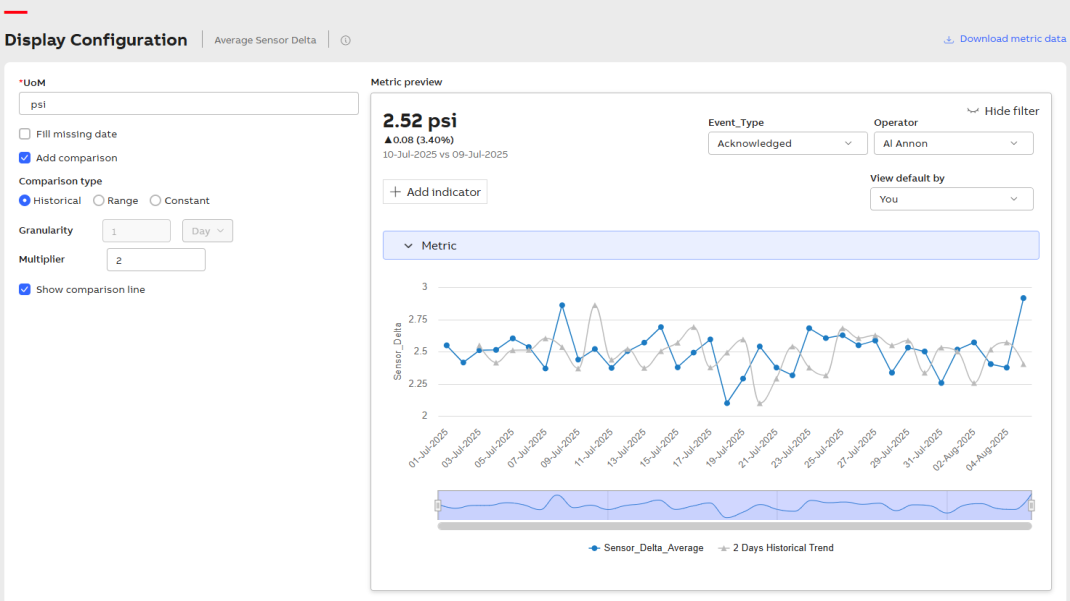
If You Choose Historical
Analyzes numerical metrics across various time periods to identify trends, patterns, and changes. The blue graph represents the current trend, while the grey graph illustrates the historical trend based on the chosen comparison period.
-
Granularity: The time period used to aggregate values for analysis.
-
Multiplier: Enter the number of months, weeks, or years of comparison you desire to view.
-
Show comparison line: Enable the checkbox to display the comparison lines.
In the following example, the multiplier is set to 2. Therefore, the comparison is between the selected date and (selected date - multiplier). For instance, selecting 10th July 2025 results in a comparison with 9th July 2025.
Comparison Types
-
-
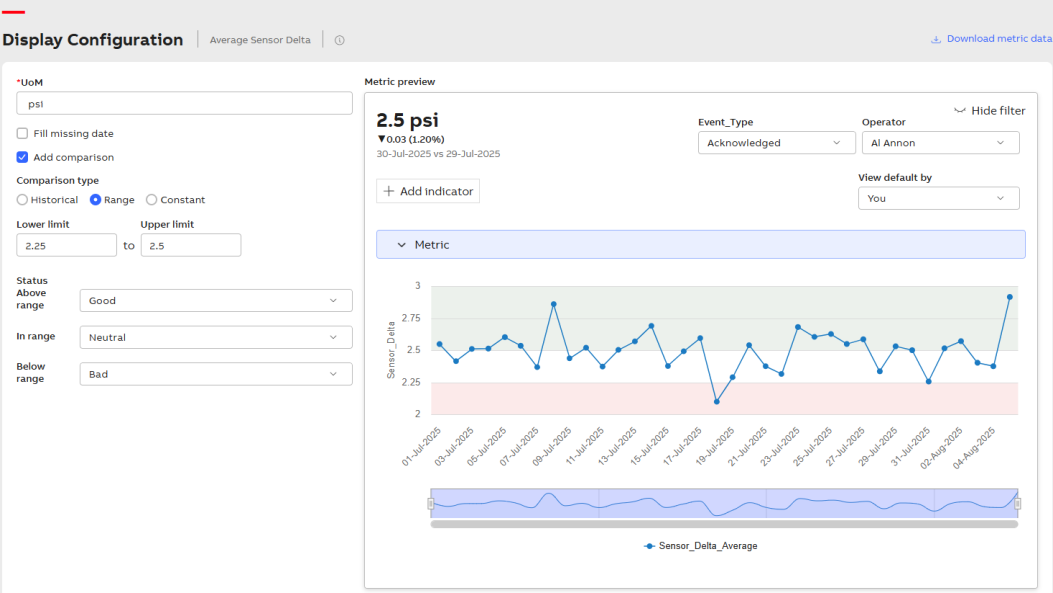
If You Choose Range
Analyzes numerical metrics within the specified range entered.
Enter values in the Lower limit and Upper limit fields to define the range.
Status
-
Select Above range for data above the specified range. It can be Good, Bad, or Neutral.
-
Select In range for data within the specified range. It can be Good, Bad, or Neutral.
-
Select Below range for data below the specified range. It can be Good, Bad, or Neutral.
Any good range is displayed as green, any neutral range as blue, and any bad range as red.
Range
-
-
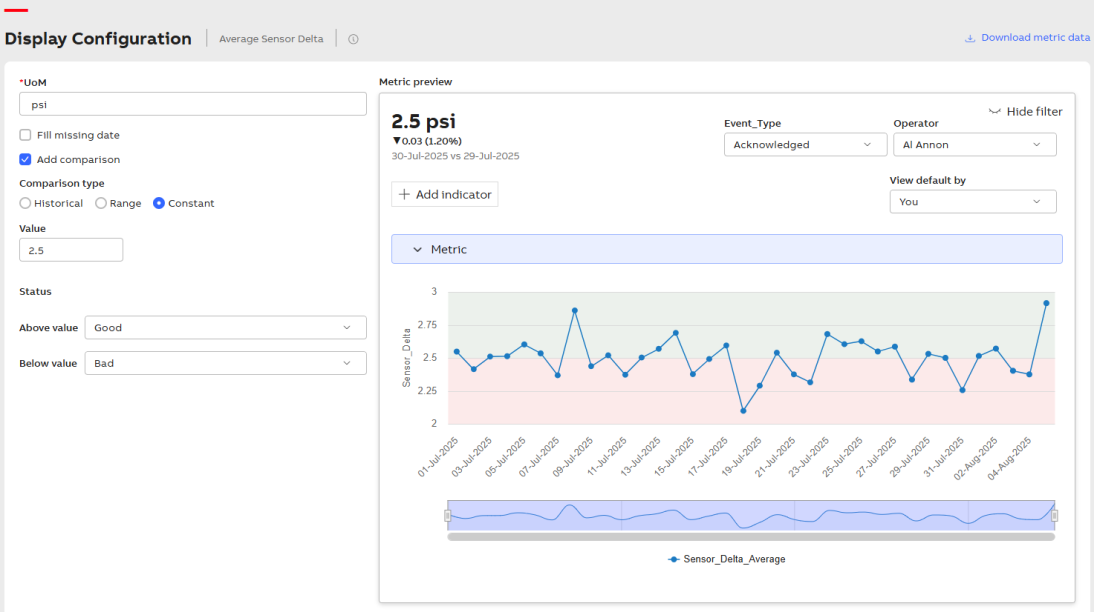
If You Choose Constant
Analyzes and visually represents the status of data using a single constant value for comparison.
Enter the threshold value in the Value field. Adjust the threshold value by increasing or decreasing it as needed.
Status
-
Select Above value for data above the threshold value (Good, Bad, or Neutral).
-
Select Below value for data below the threshold value (Good, Bad, or Neutral).
Type of Values
-
-
-
Dimension type: Allows you to select dimension types from the dropdown and apply filters based on the configured dimensions of the metric.
-
View default by: Offers visibility into how metric data is displayed by allowing users to select a preferred default view or filter.
-
Click + Add indicator to open Select Indicators pop-up window.
-
Use the checkboxes to select the desired derivation type.

Select Indicators
- Moving Sum:A moving sum is a calculation that determines the sum of a set number of previous values in a dataset as it progresses over time. It is commonly used in time series analysis to smooth fluctuations and identify trends.
-
Moving Average: A moving average is the average of a set number of previous values over a rolling window. It helps smooth out short-term fluctuations and highlights longer-term trends.
-
Running Total: A running total (also called a cumulative sum) is a continuously updated sum that adds each new value to the previous total.
-
Click Apply. Once the derived metric calculation is complete, the metric preview becomes available.
-
The value of 2.6 psi on July 5, 2025, is selected within the trend. Hence, based on the granularity selected, the selected data point metric value is compared with (selected data point-granularity) 5-July-2025-1 day = 4-July-2025, having value 2.51.
-
This allows for a comparison between July 5, 2025, and July 4, 2025.
-
It indicates the metric value increased by 0.09 units from July 4 to July 5, resulting in a percentage increase of 3.56%.
-
Click Save.
-
Click Next.
Metric Preview Formats
Format 1
Show/Hide filter: Enables/disables the following options.
Add Indicator
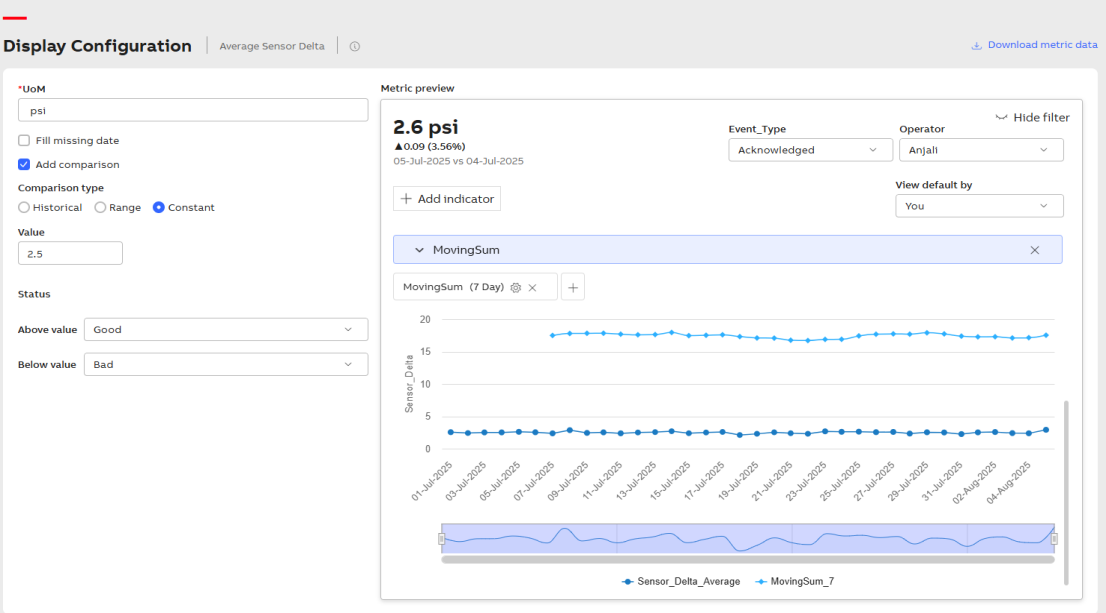
Format 1
Format 2
The granularity selected under metric definition is one day.
As illustrated in the example,
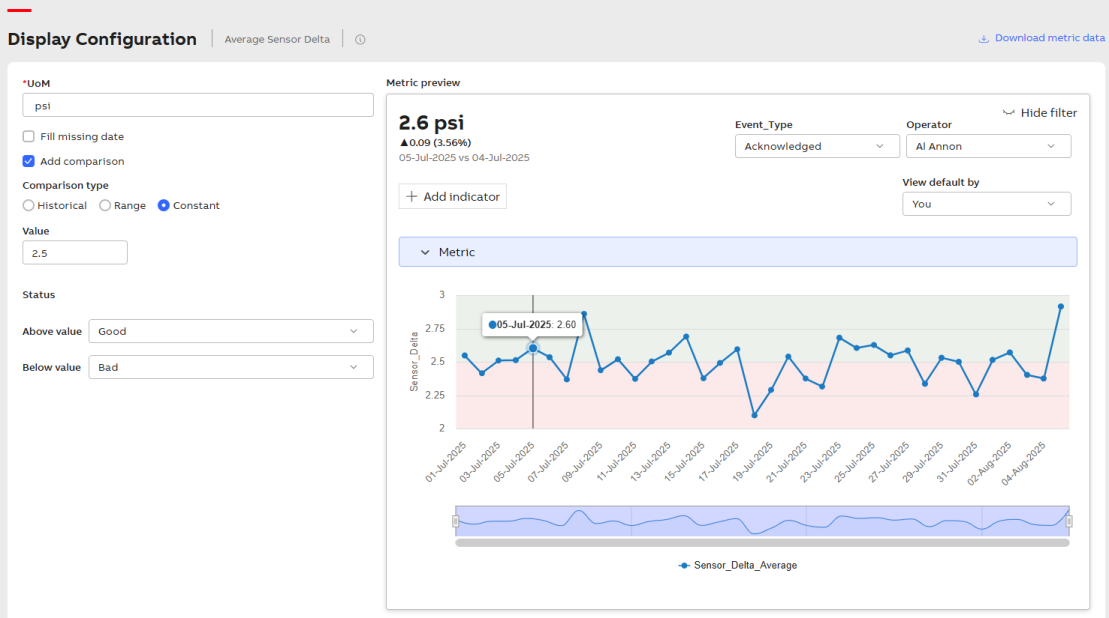
Format 2
Available Options
- Zoom: Zoom in to select a specific date range.
-
Download the metric data: Click Download metric data to download a local csv file with calculated metric data.