

Data Source
The Data Source tab enables you to select the source and location of the data to be displayed in the widgets.
Data Source Options
You can select data using one of the following options: Variable and WebAPI.
Variable
Select the Variable tab to choose a predefined set of data from the Variables dropdown list. The variables created using the Create Variable option are displayed in the list.
For more information, see Variables.
WebAPI
By default, the WebAPI tab is selected.
Data Source
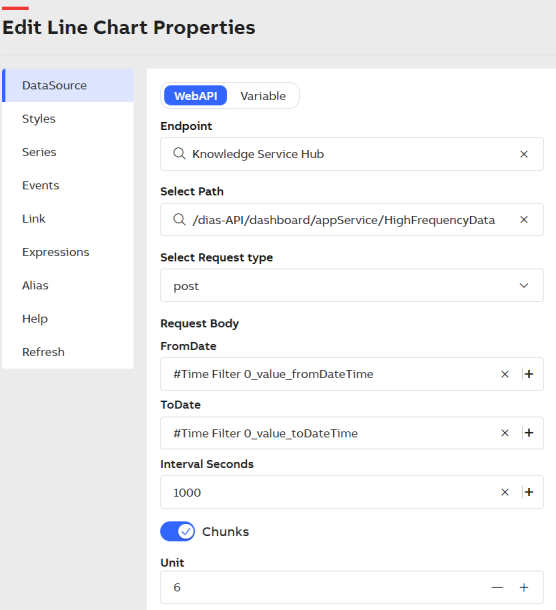
The following configuration options are available for the WebAPI section:
|
Option |
Description |
|
Endpoint |
Select a Data Source from the dropdown list of Data Sources that are configured in Dashboard application. |
|
Select Path |
Select the path of the available data set from the dropdown list. |
|
Select Request Type |
Select a request type from the dropdown list. |
|
Parameters |
The property pane is populated with details to configure based on the API Method selected in the Select Path dropdown. Enter the required details for data visualization. Click + icon to open the Parameter Value Configuration window. Multiple parameters are supported, including Current Widget, Other Widgets, From Attributes, Time Filters, Variables, and Expressions. Select the radio button to select the respective parameters. For more information, see Variable Usage . |
|
Date Parameters |
FromDate: Select the option to specify the start date from which data is available from the source. ToDate: Select the option to specify the end date until which data is available from the source. The supported Datetime format is yyyy-mm-dd hh:mm:ss. To enable Chunks and Realtime options, in the Parameter Value Configuration pop-up the Time filter parameter must be selected for both FromDate and ToDate fields. Chunks To load huge volume of data in real time, the high frequency data loading option is available. This enables to split the data into smaller chunk of duration and update the data in the dashboard, avoiding the performance issue that will be caused due to the huge data. Enable the Chunks option and configure the following:
Example: If the date range is from 08:00:00 to 12:00:00 and the interval is 5 seconds, enabling the chunk option with a 10-minute interval updates the dashboard every 10 minutes. By the end of 4 hours, all 24 data chunks are displayed in the dashboard. The widget-level time filter takes priority over the dashboard-level filter when both are applied. Realtime To update your dashboard with realtime incremental data updated as per the defined interval.
Chunks and Realtime options are available only for timeseries type of data source only after you enable the Time Filter option under Properties. |
OData Configuration
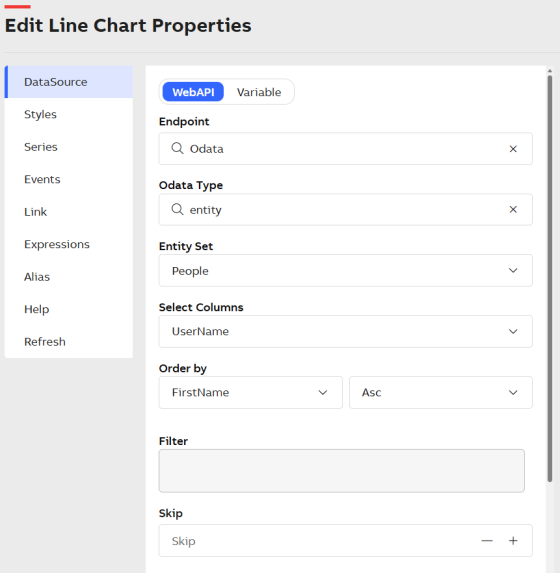
Select OData from the Endpoint dropdown list to configure an OData-based data source.
Data Source - Odata
The following configuration options are available for the OData WebAPI section:
|
Option |
Description |
|
OdataType |
Select the Odata type from the dropdown. It provides the following options.
|
|
entity.select |
Select the entity from the dropdown list. |
|
entity.columns |
Select the required columns of the entity. |
|
entity.orderBy |
Select the entity and sorting order to sort the data. |
|
entity.filter |
Click + Add Rule and + Add Group to enter the parameterized values to refine the data selection. |
|
entity.skip |
Enter the number of records to skip in the result set. |
|
entity.limit |
Enter the maximum number of records to include in the result set. |
Click Preview to view the tabulated data of a specific data set with relevant fields.
The preview reflects real-time data used by the widget.
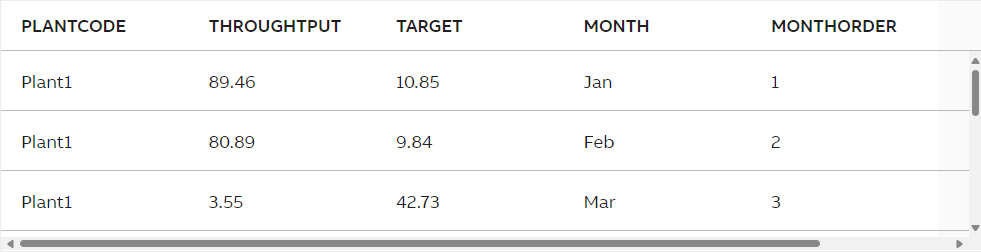
Tabulated Data preview