

Dashboard
Dashboard in the Assess 360 application enables you to visualize and get an overview of the Assess 360 of all the projects at an enterprise level through various tiles, graphs and charts.
To access the Dashboard module, go to Assess 360 > Dashboard.
You can also click  icon in the menu bar on the left of the Assess 360 application from the Portfolio Management, Project Management, or Deterioration Library modules. The Dashboard is displayed.
Dashboard
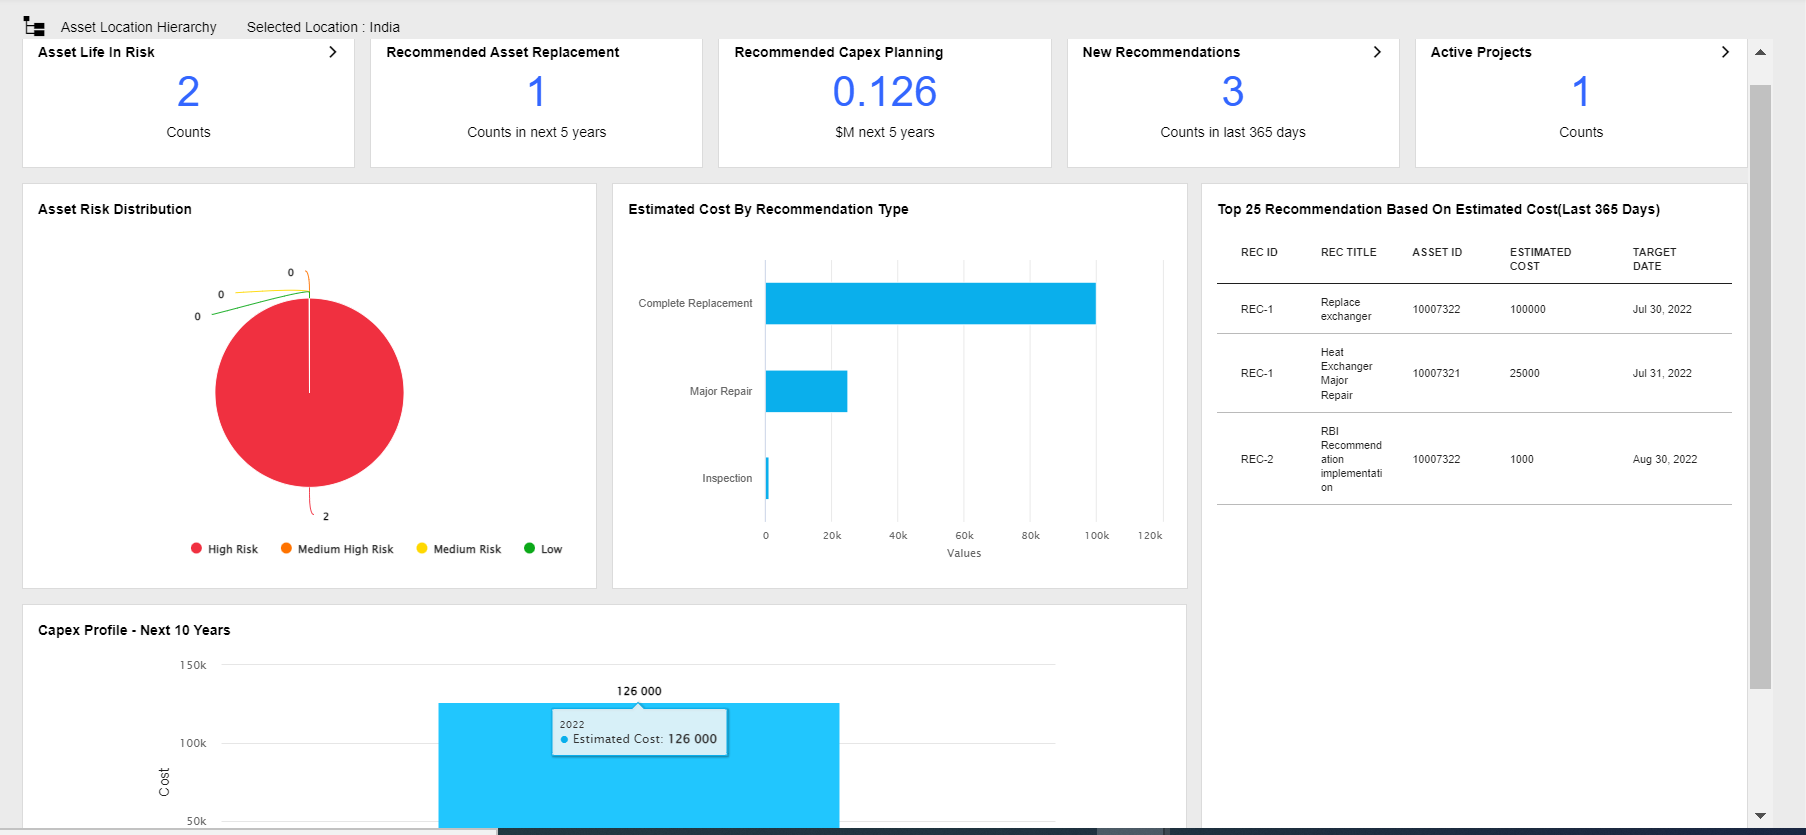
The following table describes each of the tiles displayed in the Dashboard.
|
Tile Name |
Description |
|
Assets Life in Risk |
Displays the number of assets which are in risk. |
|
Recommended Asset Replacement |
Displays the number of assets which are recommended to be replaced in the next five years. |
|
Recommended Capex Planning |
Displays the forecasted amount of capital expenditure in the next five years. |
|
New Recommendations |
Displays the number of new recommendations in the last 365 days. |
|
Active Projects |
Displays the number of projects which are in active status. |
|
Asset Risk Distribution |
Displays the distribution of asset risk in a pie chart. Each pie slice represents the assets which are at different levels of risk, it can be:
The number of assets at risk is also displayed in each pie slice. |
|
Estimated Cost by Recommendation Type |
Displays the estimated cost based on the type of recommendation in a bar chart. The different types of recommendations can be complete replacement, major repair, minor repair and so on. |
|
Top 25 Recommendation Based on Estimated Cost(Last 365 days) |
Displays the top 25 recommendations based on the estimated cost in the last 365 days in a table. The respective details of these recommendations are displayed in the following columns:
|
|
Capex Profile - Next 10 Years |
Displays the forecasted amount of capital expenditure in each year for the next 10 years in a bar chart. |
Asset Location Hierarchy Filter
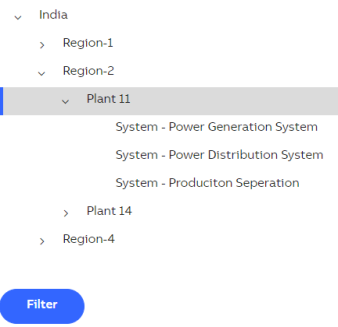
This function is helpful when you are aware of the functional location of the Asset. Perform the following steps to locate the Asset from the Asset Location Hierarchy:
-
Click the
 Asset Location Hierarchy icon in the upper-left corner of the Dashboard. A window is displayed with the list of all the hierarchical locations.
 -
Locate and select the Asset group to which the asset you want to find belongs to and click Filter. Assets will be filtered and only the assets tagged under the selected group are listed. The selected location is displayed.
Asset Location Hierarchy Filter
You can click the following tiles in the Dashboard and view the respective data:
-
Asset Life in Risk
-
New Recommendations
-
Active Projects
Asset Life in Risk
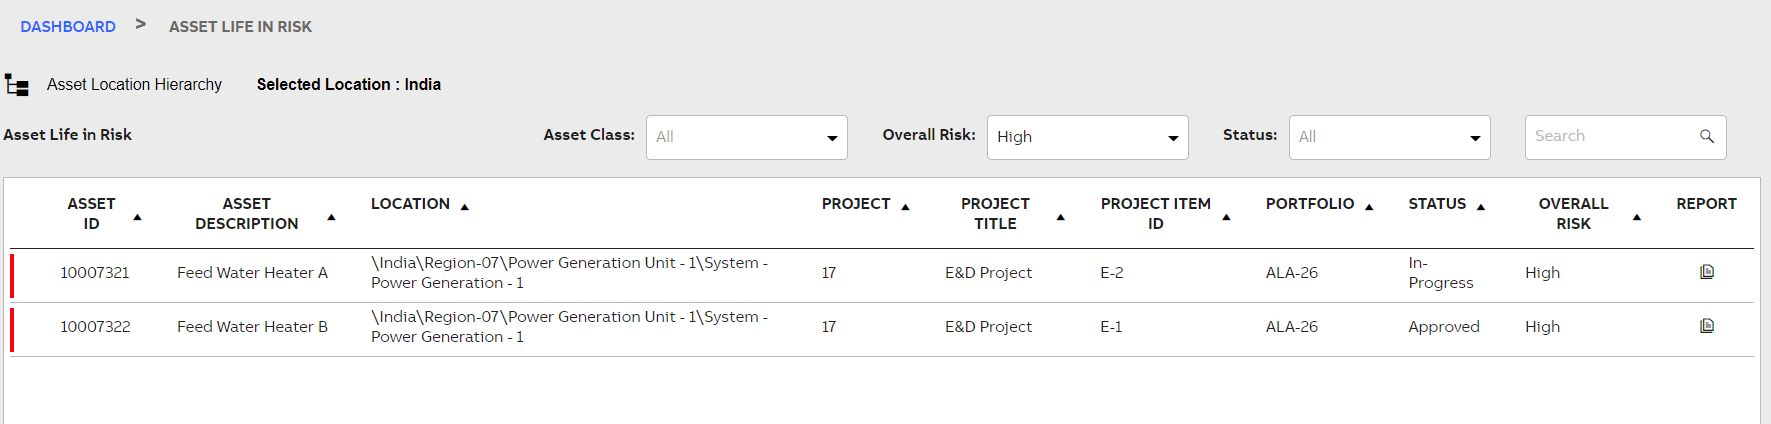
Click the Asset Life in Risk tile to view the details of all the assets that are at risk. The Asset Life in Risk page is displayed.
Asset Life in Risk
The following table describes each of the columns displayed in the Asset Life in Risk page.
|
Column Name |
Description |
|
Asset ID |
Unique ID of the asset. |
|
Asset Description |
Brief description of the asset. |
|
Location |
Location of the asset. |
|
Project |
Unique ID of the project. |
|
Project Title |
Title of the project. |
|
Project Item ID |
Unique ID of the project item. |
|
Portfolio |
Unique ID of the portfolio. |
|
Status |
Status of the asset. |
|
Overall Risk |
Overall risk level of the asset. |
|
Report |
|
The color of the indicator next to the Asset ID in the Asset Life in Risk page is displayed as per the following overall risk level:
-
Red, if the overall risk level of the asset is high.
-
Amber, if the overall risk level of the asset is medium high.
-
Yellow, if the overall risk level of the asset is medium.
-
Green, if the overall risk level of the asset is low.
Project Asset Report
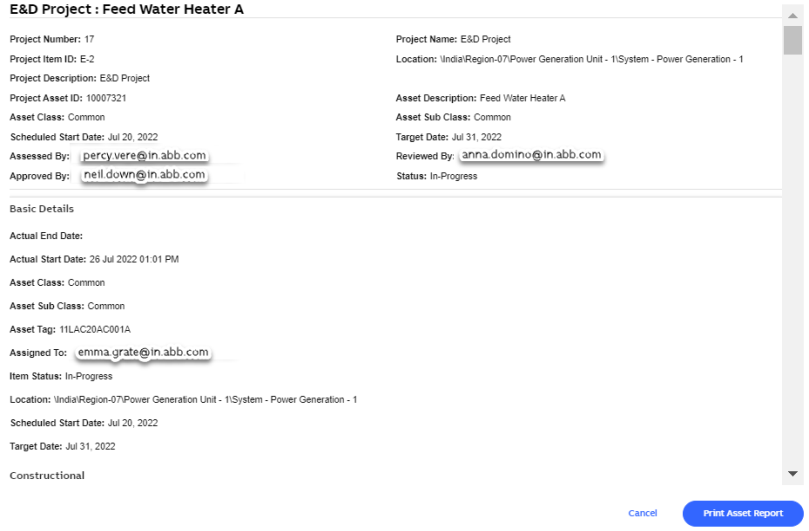
In the Report column of the Asset Life in Risk page, click  icon of the asset for which you want to view and print the respective project asset report. The Project Asset Report is displayed.
Click Print Asset Report to download and print the asset report.
Project Asset Report
Filter the Assets
You can perform the following actions in the Asset Life in Risk page to filter the assets:
-
From the Asset Class dropdown list, select the asset class to filter and display the assets specific to the selected class.
-
From the Overall Risk dropdown list, select one of the following levels of risk to filter and display the assets accordingly:
-
All
-
High
-
Medium High
-
Medium
-
Low
By default, High is selected.
-
-
From the Status dropdown list, select the status to filter and display the assets in the respective status:
-
Draft
-
In-Progress
-
Approved
-
Pending Review
-
In the Search box, enter a key string which is a part of Asset Number, Asset Tag or Asset Description of the desired Asset and click the search icon to find and display the specific asset in the Asset Life in Risk page.
New Recommendations
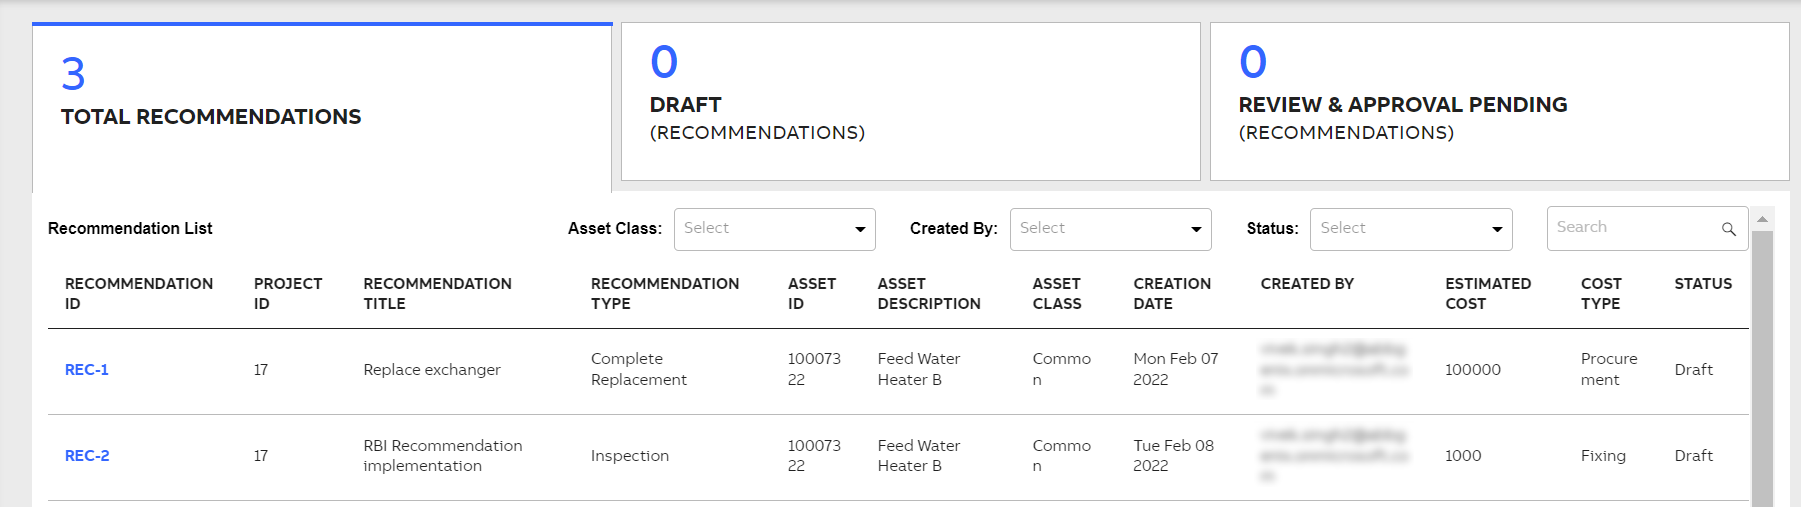
Click the New Recommendations tile to view the details of all the recommendations. The following tiles are displayed:
-
Total Recommendations: Displays the total number of recommendations and the respective details across the projects.
-
Draft (Recommendations): Displays the total number of recommendations and the respective details across the projects, which are in draft status.
-
Review & Approval Pending (Recommendations): Displays the total number of recommendations and the respective details across the projects, which are pending for review and approval.
By default, the Total Recommendations tile is displayed. You can click the Draft (Recommendations) and Review & Approval Pending (Recommendations) tiles to view the respective recommendations.
Recommendations
The following table describes the columns of Recommendations List displayed in each of the New Recommendations tiles.
|
Column Name |
Description |
|
Recommendation ID |
Unique ID of the recommendation. |
|
Project ID |
Unique ID of the project. |
|
Recommendation Title |
Title of the recommendation. |
|
Recommendation Type |
Type of recommendation. It can be replacement, redesign and so on. |
|
Asset ID |
Unique ID of the asset. |
|
Asset Description |
Brief description of the asset. |
|
Asset Class |
Specific class of the asset. |
|
Creation Date |
Date when the recommendation was created. |
|
Created By |
Name of the user who has created the recommendation. |
|
Estimated Cost |
Cost estimated to perform the recommended action. |
|
Cost Type |
Type of cost for the recommended action. |
|
Status |
Status of the recommended action, can be draft, approved and so on. |
Click the Recommendation ID of a recommendation for which you want to view details. The Recommendation Details window is displayed.
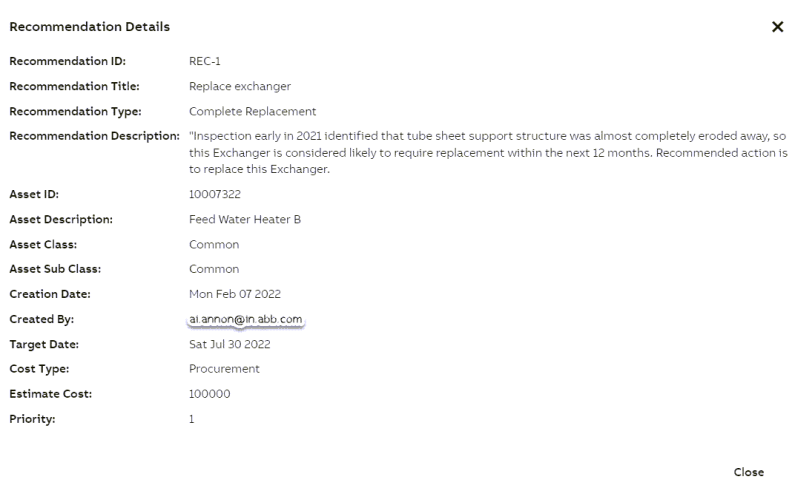
Recommendation Details
Filter the Recommendations
You can perform the following actions in each of the New Recommendations tiles to filter the recommendations:
-
From the Asset Class dropdown list, select the asset class to filter and display the recommendations specific to the selected class.
-
From the Created By dropdown list, select the user to filter and display the recommendations created by the selected user.
-
From the Status dropdown list, select the status to filter and display the recommendations in the respective status:
-
Draft
-
Approved
-
Review Pending
-
In the Search box, enter the respective details of a recommendation to find and display the specific recommendation.
Active Projects
Click the Active Projects tile to view the details of all the active projects. You will be navigated to Project Management module of the Assess 360 application. For information on the tabs displayed in the Project Management module and the respective details see Project Management.